


With statistical sampling, counsel can simplify damage analyses, avoid potential issues with incomplete or missing data, and minimize the risk of error.
Questions Counsel Should Ask After the Decision to Sample is Made:
- What is statistical inference?
- What does the margin of error (MoE) and confidence level mean?
- What types of sampling methods are there?
- How can I be confident in the results of the sample?
Recap From Last Time
In our prior article, we discussed how and why you should sample because statistical sampling is a generally accepted methodology used to make inferences about populations. When done correctly, statistical samples can produce valid and reliable results. Courts and regulatory agencies alike have acknowledged and allowed for the use of statistical sampling in situations where data may be incomplete, too unorganized, or costly to analyze in its entirety. Additionally, sampling can provide distinct benefits over evaluating all available data. Those benefits include:
- Simplifying complicated data to a smaller, representative subset allows for a more detailed review of the data that is smaller and easier to manage.
- Filling in data gaps because the sample is drawn from available records, and the summary statistics from that sample can be used to estimate missing data.
- Limiting specific review because statistical sampling offers the benefit of reviewing a subset of the larger population but maintaining nearly as accurate results as if the entire population had been analyzed. Furthermore, the results could be more accurate because fewer data points need to be analyzed, and more care could be taken with each data point.
Statistical Inference
Statistical inference is the process of using summary statistics derived from a sample that is drawn from a population at random[1] to test a hypothesis about the population. In most cases, the sample is used to derive a point estimate — typically the average value — and an interval estimate — typically the confidence interval. The average value is assumed to represent the entire population, and the error of that estimate is defined by the width of the confidence interval.
Before sampling is conducted, an MoE and confidence level should be pre-defined, and the sample is drawn with consideration to the amount of error that the research is willing to accept. Depending on the size of the population, the sample will require a different number of observations to achieve the pre-defined MoE and confidence level. However, if the population is large enough, there are three rule-of-thumb numbers for sample size: 1) approximately 400 observations for a 95% confidence in a +/- 5.0% MoE; 2) approximately 1400 observations for 95% confidence in a +/- 2.5% MoE; and 3) approximately 10,000 observations for 99% confidence in a +/-1.0% MoE. The following table is based on a population of approximately 30,000 observations. A 95% confidence level and a +/- 5% MoE are commonly used benchmarks.[2]
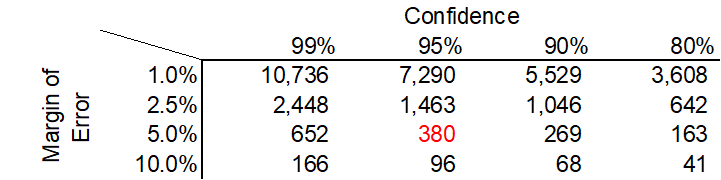
Based on the above table, if we were to conduct 100 separate random samples of 380 observations, each from our population of approximately 30,000 observations, we would expect the true population value to fall within the MoE 95 times out of 100.
Types of Random Samples
There are many types of statistical sampling techniques, but the most important item to consider about sampling is that the items in the population are random and each have an equal chance of being selected. We will discuss the simple random sampling and stratified (or proportional) random sampling.
Simple Random Sampling
Simple random sampling is just that, simple. Let us consider that the entire population is in one room and that population has 30,000 people in it. An analyst wants to gather a sample of 380 people to analyze. Each person is assigned a number from one to 30,000, and the analyst has a gigantic urn filled with numbered balls from one to 30,000. The analyst selects numbers from one to 30,000 randomly until 380 people are chosen.
For example, the analyst draws the number 56 randomly from the urn. The person with number 56 has been selected and is removed from the room and from the urn. The analyst then draws number 20,042 from the urn, and the person with number 20,042 is selected. This process continues until 380 people are selected.
Stratified Random Sampling
Stratified random sampling works in a similar way to simple random sampling, but the analyst takes into account a known population distribution when drawing a sample. For example, let us propose that a company has decided to analyze employees in the organization.
The company has three different business units and suspects that there will be a difference between those business units. If the analyst sampled using a simple random sample methodology, then they may over or under-select certain business groups. Since the Simple Random Sample method does not consider specific subgroups, then it is possible for the random sample to be skewed. This issue can be serious if one business group is the vast majority of the company (say, greater than 90% of the company). It would be possible to draw a statistically valid random sample that does not select any records from the other business groups due to their size.
In the stratified random sampling approach, the analyst enforces the proportions of individual subgroups. In this example, suppose the analyst wanted to analyze 380 employees and that the population proportion of the business groups was 50%, 30%, and 20%, respectively. Now, instead of there being one room with 30,000 people, there are three rooms with 15,000, 9,000, and 6,000 people, respectively. The analyst will randomly draw people from each room until there are 380 total people, but this process will be proportional to the existing population. Therefore, 190 from room one, 114 from room two, and 76 from room three. This ensures that all subgroups are sampled from, and the results of the sample will be proportional to the population.
Next Time, We Will Cover Questions Counsel Should Ask After the Analysis Has Been Conducted:
- What are sample statistics?
- How do those sample statistics relate to the population?
- How do I extrapolate and interpret the results?
Takeaway
Statistical sampling, when done properly, can allow for a simplified analysis while producing reliable results. The goal of statistical inference is to use the sample to estimate features of the population, and the confidence and precision of those features is a function of the number of observations in the population and in the sample. Depending on the needs of the analysis and existing known information, an analyst can select additional or fewer records and achieve more or less precise estimates with a set confidence level and derive samples that mirror known information about the population.
Ankura's Labor and Employment Litigation Experience
Ankura’s experts have extensive consulting experience in labor and employment litigation, settlement procedures, and compliance reviews. Our experts are adept at analyzing data from disparate sources that are not easily linked, distilling volumes of data and complex issues into meaningful and defensible conclusions, and quickly communicating a message through data visualizations.
Ankura’s labor and employment litigation experience includes accounting, finance, economic, and big data specialists, as well as industry and class certification experts. Our experience covers the entire spectrum of services, from discovery management and class certification defense to expert testimony and liability, damages assessments, and compliance audits. Our experts assist companies in class action matters as well as calculate lost income due to personal injury, medical malpractice, discrimination, and wrongful termination allegations.
We assist companies in reviewing their payroll process and systems to assess potential risk areas in companies’ policies and procedures, processes, and payments. Our experts have deep experience reviewing benefits and payments, including whether workers’ compensation related to disability payments were paid appropriately.
Notes:
[1] A random sample minimizes any systematic bias that could be introduced if the sample was not drawn randomly. (See Dattalo, P. (2010). Strategies to Approximate Random Sampling and Assignment. New York, NY: Oxford University Press, p.20.)
[2] Reference Manual on Scientific Evidence. National Academies Press, 2011, pgs. 244, 245. However, benchmarks can be different for different industries and type of work.
Sign up to receive all the latest insights from Ankura. Subscribe now
© Copyright 2025. The views expressed herein are those of the author(s) and not necessarily the views of Ankura Consulting Group, LLC., its management, its subsidiaries, its affiliates, or its other professionals. Ankura is not a law firm and cannot provide legal advice.
