


Recap From Last Time
In our first installment, we discussed the general changes to the Private Attorneys General Act (PAGA) that took effect in June 2024. We noted that these changes lowered penalties and allowed companies a longer horizon to remediate. In addition to a spike in filings before June 2024, the overall trend appears to show a continued increase in PAGA filings. This installment will focus on the cost for companies that do not remediate issues when receiving a PAGA notice. We explore the settlement costs that we have aggregated in a PAGA database prepared by Ankura.[1]
Data Gathering and Methods of Processing[2]
This analysis relies on the same document database that was gathered for our first article on PAGA.[3] However, this data was constructed from settlement and judgment filings that the state of California gathers when a PAGA action is finalized. We deployed similar tools that were trained to recognize and extract key text from settlement and judgment documents.[4] To capture the amounts of settlements and judgments, we deployed a specialized large language model (LLM) to read the documents and extract key pieces of information that are contained within the documents. We gathered this data into a database and explored judgments and settlements.
Summary Analysis
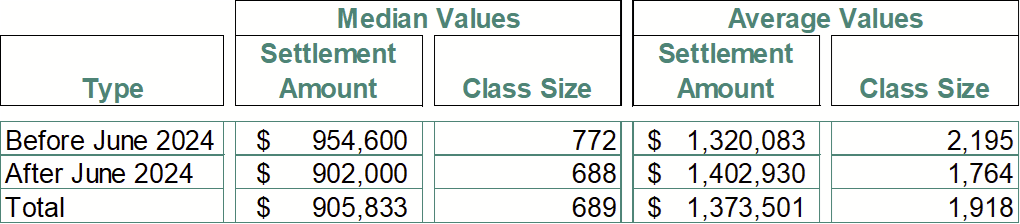
This data provides a basis to calculate various summary statistics and to trend the data over time. There has been a decrease in the median class sizes and settlement amounts. The average value has increased due to some cases with larger class sizes settling after June 2024. This is an interesting trend that can be analyzed further as more judgments/settlements are finalized over time. We show the average and the median values. The average is an unbiased estimator of a series of continuous data points, but averages are susceptible to outliers. The median shows the 50th percentile, or the mid-point of the distribution, and it is resistant to outliers.[5] The table is based on 335 cases with judgments that show the gross settlement value and the number of class members.
Table 1 – Summary Statistics for Settlement Amounts and Class Sizes
If you are interested in understanding this database in more detail, such as the settlement value for different industries, issues, employers, and/or law firms, please reach out to me or my team. We are happy to discuss further insights that can be gathered from this data.
In our next installment, we will explore industry and law firm trends.
[1] PAGA database covers PAGA filings, settlements, and judgments from 2019 to the present. We have developed this data by gathering publicly available legal documents. We have ingested those documents and scraped them for their content (e.g., settlement amounts, number of class members, etc…).
[3] https://angle.ankura.com/post/102kzil/a-new-day-in-the-life-of-a-paga-action-1-year-after-the-change-in-californias-p
[5] 50% of the values in the distribution are above the median, and 50% are below. \
Sign up to receive all the latest insights from Ankura. Subscribe now
© Copyright 2025. The views expressed herein are those of the author(s) and not necessarily the views of Ankura Consulting Group, LLC., its management, its subsidiaries, its affiliates, or its other professionals. Ankura is not a law firm and cannot provide legal advice.
